
Growth Chart Graph Menu
After you generate a growth chart, you can right-click the graph to display the Growth Chart Graph menu.
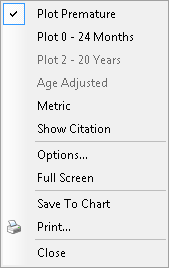
The following table describes each type of command:
| Command | Description |
|---|---|
| Plot Premature | Patients who are considered premature and have a gestational age of 50 weeks or less default to the premature plot. A check mark indicates that this plot is adjusted automatically for prematurity. Premature plots are not generated for Turner syndrome patients. |
| Plot (Age range) | Displays the age range(s) that can be plotted for this type of graph. The following age ranges may be shown depending on the patient's age and type of graph: 0-24 months, 0-36 months, 2-18 years, 1-20 years, or 2-20 years. A check mark indicates the age range currently plotted. You can select another age range, if available. |
| Age Adjusted | This command is not applicable to premature growth charts or a Weight for Length growth chart. It may not be active for other types of growth charts. Manually adjust the plot using the gestational age, instead of the chronological age, for a patient born prematurely. The adjusted age is calculated by subtracting the gestational weeks from the full-term weeks to determine the weeks born prematurely. Then the result is subtracted from the chronological age. For example, for an 8-week old child with a gestational age of 34 weeks, the calculation is (8 - (40 - 34)) = 2 weeks. The graph is adjusted to plot the child at 2 weeks instead of 8 weeks. |
| Metric | For the Age vs. Height, Age vs. Weight, Age vs. Head Circumference, and Weight for Length growth charts, you can view the metric measurements. |
| Show Citation | Displays a citation for premature, Down syndrome, or Turner syndrome data on the graph. |
| Options | Displays the Graph Options window to customize the graph interval times and colors. |
| Full Screen | Displays the graph without the NextGen® Enterprise EHR menu bars and enlarge it to fill the entire screen. You can switch back to the regular view. |
| Save To Chart | Saves the graph to the patient chart. |
| Prints the graph on your printer. | |
| Close | Closes the growth chart. |