
Selecting a Chart Type
To specify the chart type, access Chart Configuration window.
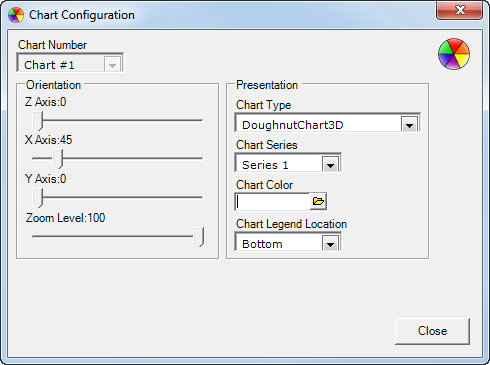
You can select the type of graph you want to use as well as the labels, legend, etc. The Chart Type field has several sections you can work with:
| Section | Description |
|---|---|
| Chart Number | This field displays the chart number. |
| Orientation | This section on the left side of the window is always visible. You can select any item in this section and format it using the formatting selections on the tab.
The list of components that you can format are:
|
| Chart Type | You can select to format your chart as 2D (two dimensional) or 3D (three dimensional). You can also select under those choices how you want the graph to present the data. You can select from:
|
| Chart Series | You can select to have the text on your chart displayed two ways:
|
| Chart Color | Allows you to select the chart color. |
| Chart Legend Location | Allows you to select the chart legend location from the following options:
|
| Close | Clears all your selections and closes the Chart Configuration window. |