Eligibility Manager Eligibility Graph
The transaction chart displays on the dashboard of the Eligibility Verification Manager window. The bar graph is a display of transactions grouped by request date.
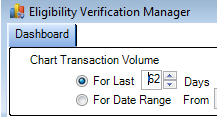
The Chart Transaction Volume allows you to chart transactions for the last 62 days. You can also select the Date Range fields to enable them.
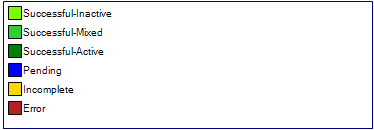
A legend in the right of the chart explains the meaning of each color in the chart.